
Este es un servicio principal para Visualiza Y- Presenta.
Lo vemos como una oportunidad para facilitar la comunicación más compleja.
Convertimos grandes entramados de contenido difícil de condensar, y que pueden llevar mucho tiempo comprender, en un conjunto sencillo, apetecible, claro y memorable.
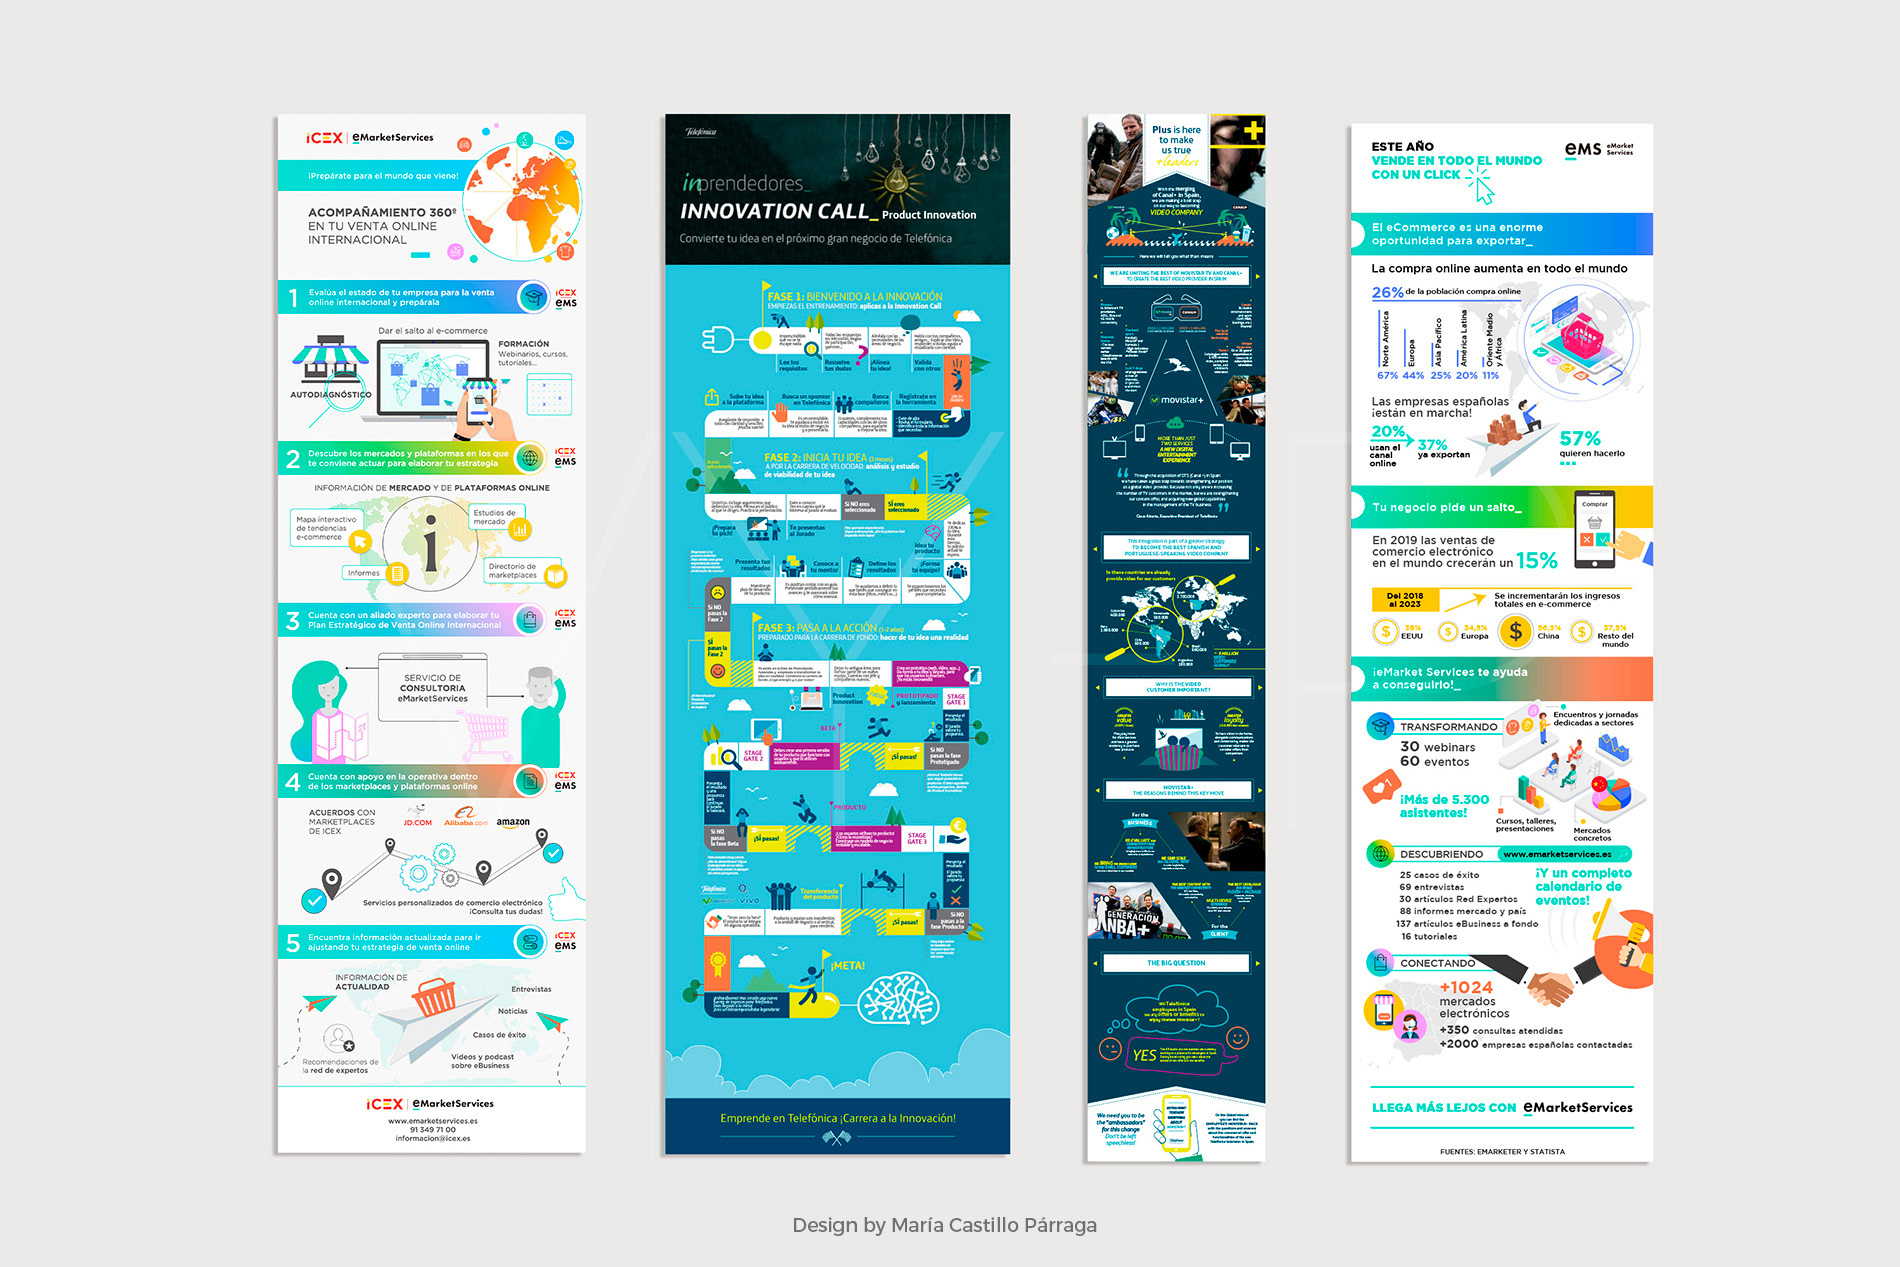
El diseño de infografías o de mapas visuales puede tener mayor o menor complejidad según el tipo de contenidos.
A veces el ejercicio consiste en comunicar resultados de una forma atractiva y amena.
Otras mostrar con claridad el orden de un proceso.
Otras consiste en ir más allá de ofrecer una visión global estructura, sino, también, crear un concepto visual o metáfora que conecta todo.
Un ejemplo de éste último ejercicio puede ser el diseño de mapas visuales que muestra toda la estrategia de una compañía.
Además, la creación de mapas visuales en los procesos de trabajo en equipo son una oportunidad para que todos los miembros compartan sus ideas y puntos de vista, enriqueciendo aún más el trabajo.
Cuando comparten la misma visión pasar a la acción es más fácil y el resultado es exponencial.
En VY-P la frase es: "AHORRA X3 usando el Pensamiento Visual":
Ahorras ANTES (cuando lo piensas y ordenas).
DURANTE (cuando lo comunicas).
Y DESPUÉS (cuando se lo llevan integrado desde la retina a la cabeza sin mayor esfuerzo).
Algunos ejemplos los puedes ver en los proyectos como el de Comeca y Leroy Merlin.
Debido al carácter privado de algunos de los proyectos realizados estos no se podrán mostrar en esta web.
This is a core service for Visualiza Y-Presenta.
We see it as an opportunity to facilitate more complex communication.
We convert large webs of content that are difficult to condense, and that can take a long time to understand, into a simple, appealing, clear and memorable whole.
The design of infographics or visual maps can be more or less complex depending on the type of content.
Sometimes the exercise is to communicate results in an attractive and entertaining way.
Sometimes it is to clearly show the order of a process.
Other times it is to go beyond providing an overview of the structure, but also to create a visual concept or metaphor that connects everything.
An example of the latter exercise can be the design of visual maps that show the entire strategy of a company.
In addition, the creation of visual maps in teamwork processes is an opportunity for all members to share their ideas and views, further enriching the work.
When they share the same vision, taking action is easier and the result is exponential.
In VY-P the phrase is: "SAVE X3 using Visual Thinking":
You save BEFORE (when you think and order).
DURING (when you communicate it).
And AFTER (when you take it integrated from the retina to the head without much effort).
Some examples can be seen in projects such as Comeca and Leroy Merlin.
Due to the private nature of some of the projects we have done, they cannot be shown on this website.
Algo muy interesante es poder adaptar una misma misma pieza creativa en diferentes formatos.
Por ejemplo, hacer una infografía que se puede contar en una presentación, que, además, puedas entregar en mano o enviar por mail y subir al un canal web interno en modo de vídeo animado.
Siempre pensando en ahorrar con una comunicación efectiva.
Something very interesting is to be able to adapt the same creative piece in different formats.
For example, make an infographic that can be told in a presentation, which, in addition, you can deliver by hand or send by mail and upload to an internal web channel as an animated video.
Always thinking about saving with effective communication.
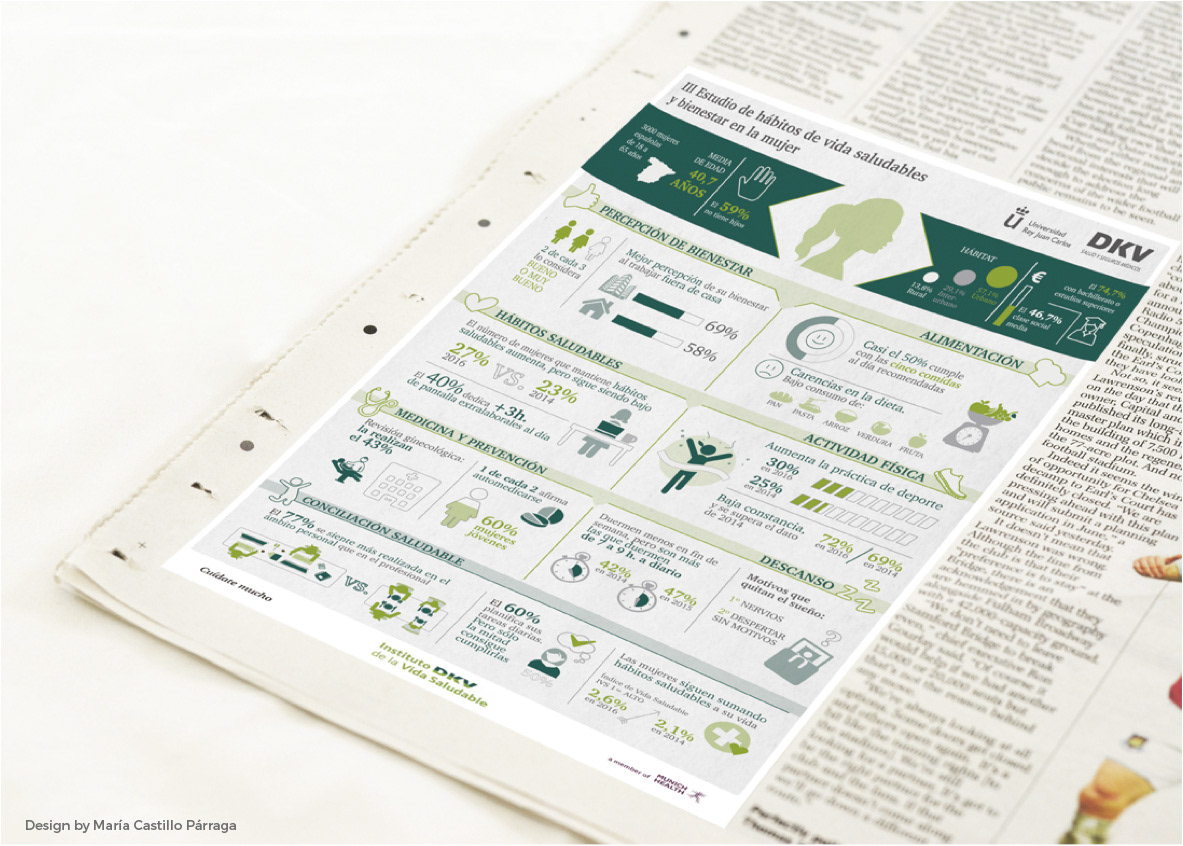
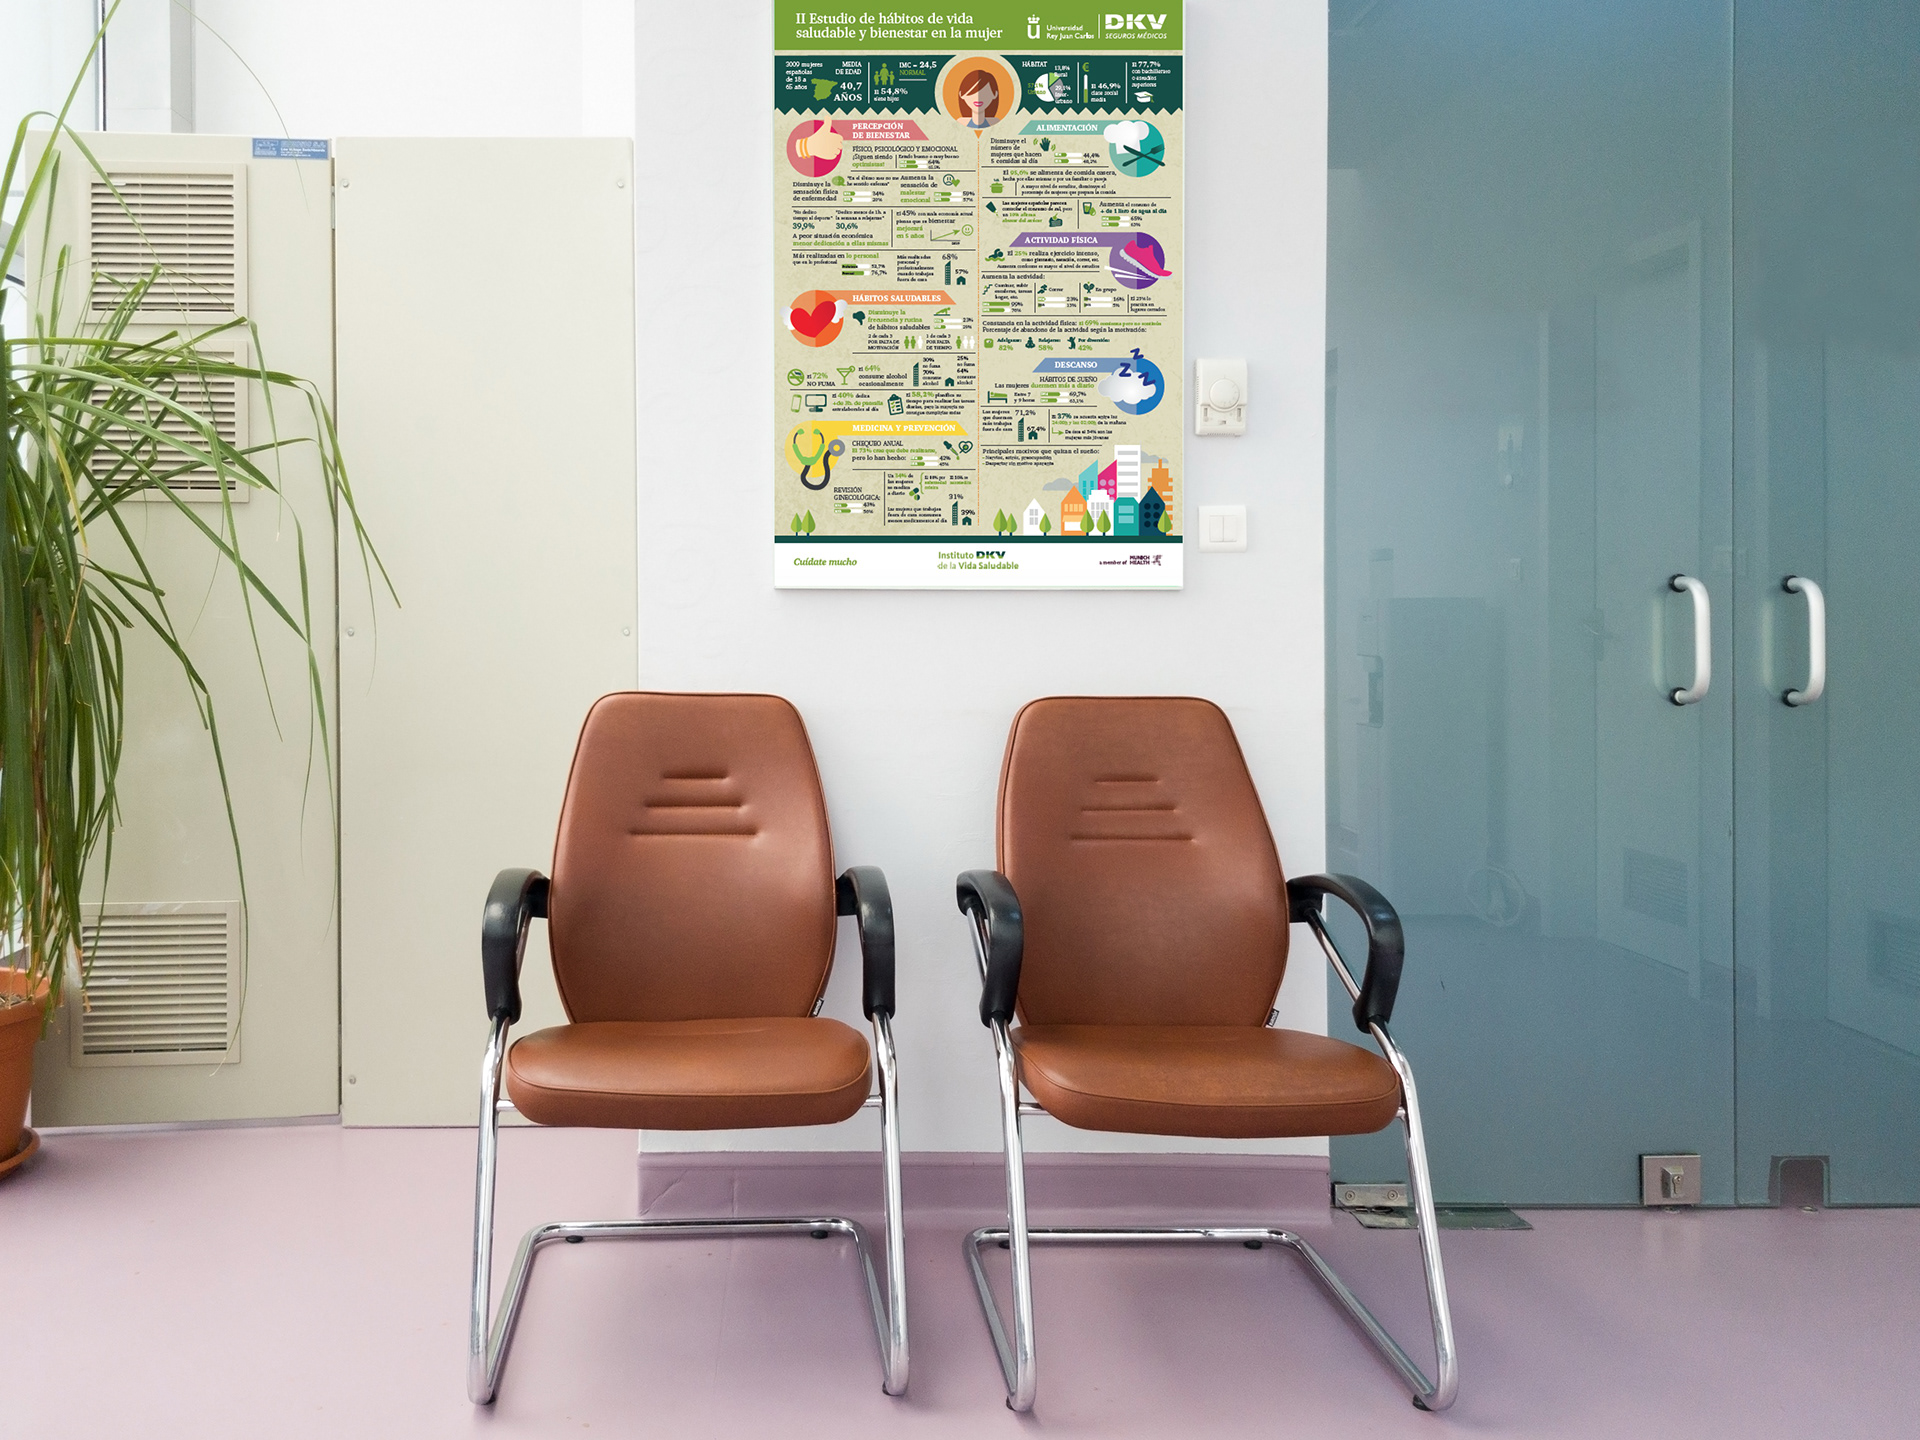
Las imágenes a continuación son infografías de resultados de estudios que se publicaban periódicamente
The images below are infographics of results of studies that were published periodically.